bookingkit Leisure Market Index – Q3 2026
Uncategorized


Record level held: Europe’s leisure market matches its all-time summer high, carried by higher prices rather than more visitors
Each month, bookingkit analyses aggregated booking and revenue data from thousands of leisure providers across Europe. The results for September and the full third quarter of 2026 show a summer that matched the record year 2025 financially, but with a different mix. Revenue landed exactly on last year’s all-time high, and August was the best single month the Index has ever recorded. At the same time, visitor numbers were 3.8% below last year in all three summer months. Prices made up the difference: the average ticket cost 3.9% more than in summer 2025.
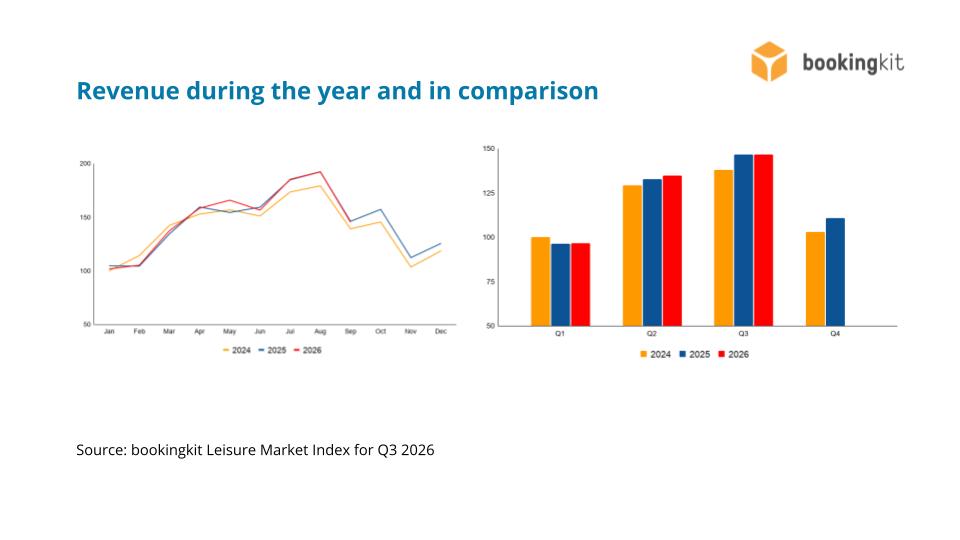
Key Insight 1: Revenue matches last year’s record, August sets a new monthly high
Q3 2026 revenue came in exactly at last year’s level, and Q3 2025 was the strongest quarter in the history of the bookingkit Leisure Market Index. July and August landed precisely on prior-year values, with August setting a new monthly record. After a record Q2, growth has paused, but at the highest level yet. The biggest weeks of the year are now behind operators, which makes this the right moment to prepare for next season: open early-bird and season-pass sales while summer visitors still remember their visit, and invite them back for autumn and winter events.
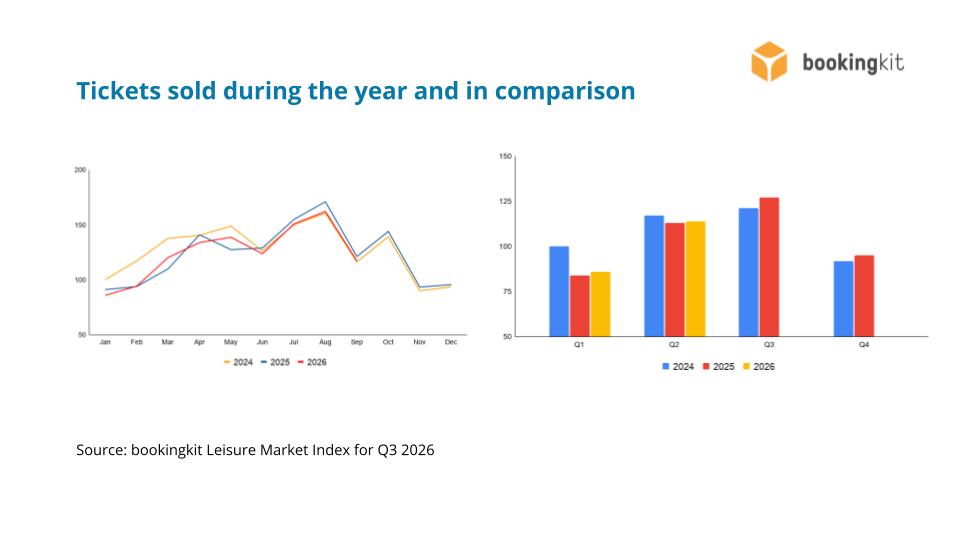
Key Insight 2: Fewer visitors in all three summer months, volumes back at 2024 levels
Ticket sales were below the previous year in July, August and September, down 3.8% across the quarter. Summer 2026 therefore fell short of the 2025 peak and came in just above Q3 2024. The strong spring did not carry through into peak season. Year to date, visitor numbers are around 1% behind 2025. Volume is now the next growth lever. Operators should make it as easy as possible to book them: at the entrance, through partners and online. That means fresh reviews, visible availability on every channel and an entrance that is ready for walk-ups.
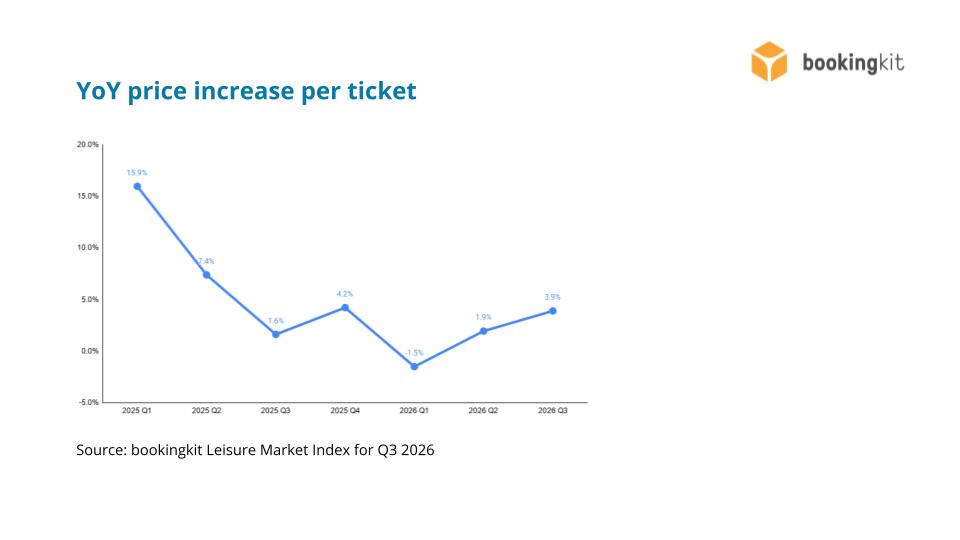
Key Insight 3: Prices carried the season, up 3.9% in the third quarter
The average ticket price in Q3 was 3.9% above last year, and in August alone it rose 5.5%. After a slight dip in Q1, price growth has now accelerated for the second quarter in a row. Higher prices are the reason revenue held at record level despite fewer visitors. Operators have shown they can raise prices, but that alone will not work every year. Rather than raising prices again, the key is to earn more per visitor: family and group tickets, add-ons, upgrades and bundles that are easy to pick in the booking flow.
Lukas C. C. Hempel, Founder & CEO of bookingkit: “Summer 2026 confirmed last year’s record revenue, but with fewer visitors paying more per ticket. Higher prices carried this season, and that will not work every year. The quieter months are now the opportunity to invest in next year’s volume: launch early-bird offers, be bookable everywhere and give every visitor a clear reason to come back.”
Pictures for media information can be found in the corresponding download folder.
About the bookingkit Leisure Market Index
The bookingkit Leisure Market Index aggregates anonymised booking and pricing data from thousands of attractions, activity providers and experience operators across Europe. It is released monthly to support operators, journalists and analysts with reliable, real-time sector insights. The Index tracks the following core metrics:
- Revenue: The gross value of ticket sales across all operators
- Tickets: The total number of admission tickets sold
- Price per ticket: How pricing evolves over time and how operators adjust their value propositions
Together, these indicators provide a clear, data-driven view of market dynamics, helping stakeholders identify emerging trends early and understand how consumer demand is shifting.
Disclaimer
The bookingkit Leisure Market Index is based on aggregated and normalised data from bookingkit customers as well as selected public and private sources. While bookingkit strives for accuracy, no guarantee is made regarding completeness or timeliness. The insights reflect bookingkit’s perspective at the time of publication and do not constitute legal, financial or investment advice. All analyses are intended for professional use only.

Frank Scheibe
Frank is a tours and activities industry expert. He reports on the latest facts, figures and trends in the bookingkit blog and the bookingkit newsletter. In his free time, he enjoys spending time with his kids and family, playing sports and eating good food.
Want to learn more about how bookingkit can help you drive conversions and get more bookings on your website?
Then get your free demo now.
Related articles

Uncategorized
bookingkit Leisure Market Index – Q3 2026
Record level held: Europe's leisure market matches its all-time summer high, carried by higher prices rather than more visitors Each month, bookingkit analyses aggregated booking and revenue data from thousands of leisure providers across Europe The results for September and the full third ...
Uncategorized
bookingkit and NaviPartner Form Strategic Partnership for End-to-End Attraction Technology
bookingkit, one of Europe's leading platforms for booking, marketing, and managing leisure experiences, and NaviPartner, the leading Danish Microsoft Solutions Partner for retail, attractions, and hospitality, are joining forces to give attractions a true one-stop shop By combining NaviPartner's ...
Industry & Trends
bookingkit Leisure Market Index – Q2 2026
Strongest second quarter on record: Europe's leisure market enters peak season with record revenue, returning demand and rising prices Each month, bookingkit analyses aggregated booking and revenue data from thousands of leisure providers across Europe The results for June and the full second ...
Press Release
Europa-Park and bookingkit Launch Technology Partnership for Digital Multichannel Ticket Sales
Germany's largest amusement park is expanding its digital infrastructure and will rely on bookingkit as its technology partner for the online distribution of experiences The Berlin-based software provider is one of Europe's leading platforms for booking, marketing, and managing leisure activities ...
Industry & Trends
bookingkit Leisure Market Index – April 2026
European leisure stays resilient: April revenue clears the historic 2024 peak, visitor numbers hold at peak levels, price volatility re-emerges Each month, bookingkit analyses aggregated booking and revenue data from thousands of leisure providers across Europe The April 2026 results confirm ...
Press Release
bookingkit appoints Megan Frydel as COO
Experienced operations leader joins Europe's leading experience booking platform to drive sustainable growth and organisational scale bookingkit, the One Platform for Attractions and the leading European booking and administration solution, has appointed Megan Frydel as its new Chief Operating ...